Live Journalctl IP Monitor and Analyzer
Project Overview:
This live journalctl IP monitor and analyzer tracks and analyzes IP addresses attempting to access your server in real-time. By monitoring the journalctl logs and extracting IP addresses, it provides insights into the traffic hitting your server and helps identify potential threats or suspicious activity.
Objectives
- Monitor and analyze IP addresses attempting to access the server in real-time.
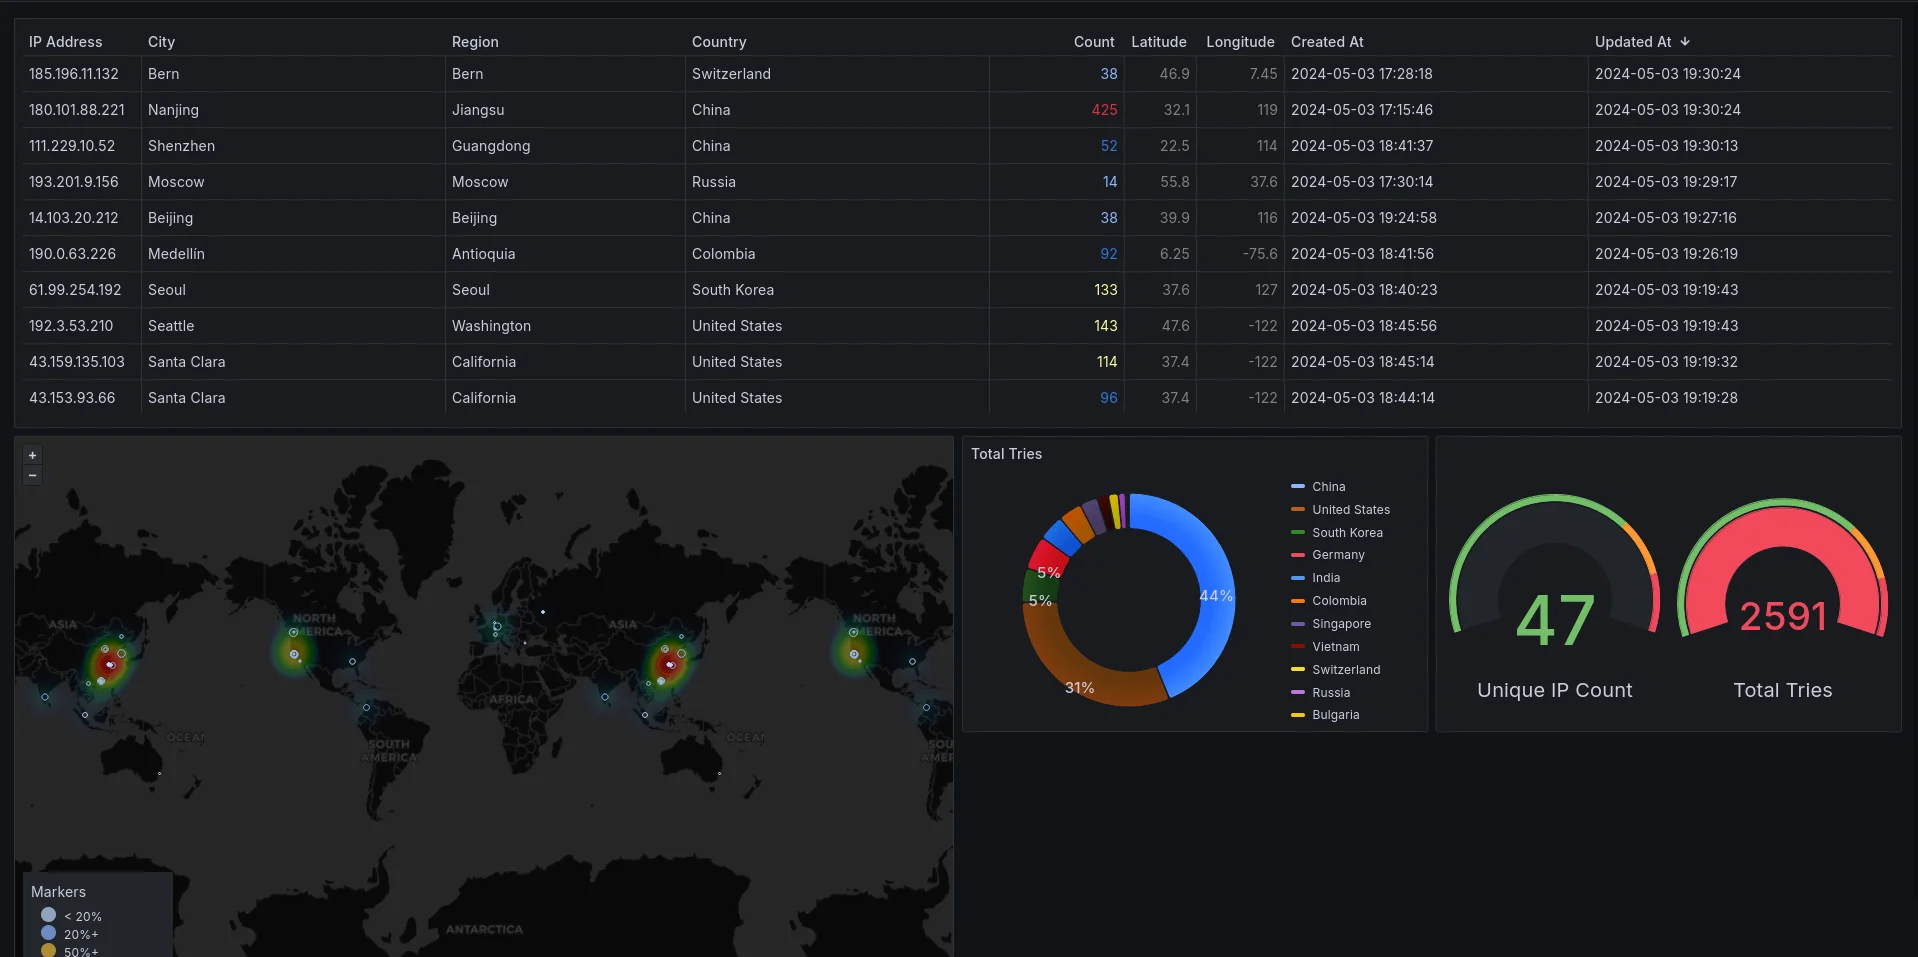
- Visualize the data using Grafana dashboards to gain insights into the traffic patterns.
- Figure out the origin of the traffic and identify potential threats or suspicious activity.
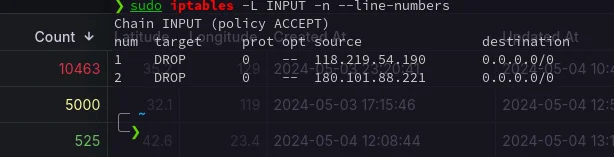
- Automate the process of blocking suspicious IP addresses based on predefined criteria.
Main Features
- Real-time Monitoring: Continuously monitors the journalctl logs for IP addresses.
- Data Extraction: Extracts IP addresses from the logs for analysis.
- ip-api: Uses the ip-api service to get detailed information about the IP addresses.
- Automatic Blocking: Automatically blocks IP addresses based on predefined criteria.
Technology Stack
- Backend: Node.js for server-side logic and API integration.
- Database: MySQL for storing the IP addresses and their details.
- Deployment: Hosted on a Raspberry Pi.
Outcome
This project has enabled me to monitor and analyze the IP addresses attempting to access my server in real-time. By visualizing the data using Grafana dashboards, I can gain insights into the traffic patterns and identify potential threats or suspicious activity.
Interested in how it works?
Check out the GitHub repository to see under the hood.